10 Years Financial Forecast and Valuation Excel Model
Excel Financial Model & Valuation.
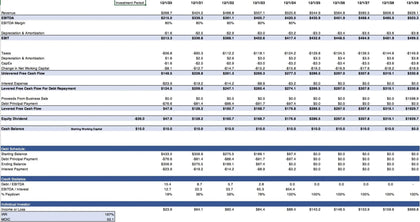
This unique generic financial model allows the user to forecast a Company's profit and loss account, balance sheet, cash flow statement, and company valuation using the DCF method.
This financial model starts with a company's historical results, and then it takes into account several drivers to project different scenarios for the business performance. These scenarios can be compared side-by-side, giving a much wider perspective on what one can expect for the business performance.
Beside the typical drivers, like revenue growth rate, gross margins, variable and fixed costs, working capital assumptions, the model has features such as operating leases, NOLs (Net operating losses) and revolving cash facilities. Being a generic model, it fits almost any company and industry.
The tabs provided can be split into two main categories:
1. Input tabs:
A) General inputs - in this tab you will enter general information about currency, valuation date, forecast years ;
B) Income Statement- in this tab the user can enter the Income Statement items (including interim accounts);
C) Balance Sheet - in this tab one can enter the historical balance sheet items(including interim accounts);
D) Cash Flow- in this tab you can enter the historical Cash Flow Statement items(including interim accounts);
E) Forecast Input:
• In this tab the user can enter up to 26 drivers for the different forecast outputs.
• The user can, easily , modul 5 scenarios.
• The automatic scenario is evaluated through the historical data.
• Some drivers are the same for the different scenarios, excepting for the Absolute scenario Case, where the user must input the values accordingly;
• For the main drivers (i.e. Revenues, Opex, Capex) the Growth % for the Base, Conservative and Stress Scenarios;
e) DCF Valuation
2. Output tabs:
A) Forecast Fin. Statement (Including Balance Sheet, Cash Flow Statement and Income Statement);
B) Forecast Fin. Highlights (containing the major financial ratios, covering Balance Structure, Debt Equity, Liquidity, Working capital, etc)
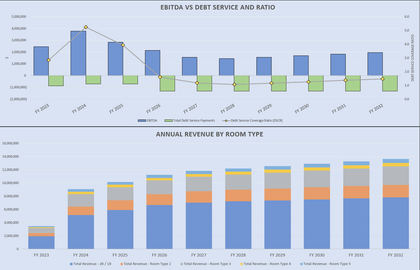
C) Cases Overview, allowing the comparison of the different scenarios (including the comparison between the Net Income, EBITDA, Free Cash Flow, Balance structure, main ratios etc).
Should you have any questions, please feel free to contact.


