
HR KPI Dashboard Excel Template
![HR KPI Dashboard Excel Template]()


This tool has been developed using Microsoft Excel.
1. This document consists of five tabs: Validations, Database, Dashboard, Monthly Comparison, and Department Comparison.
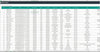
2. Begin by inputting your employees' information into the database sheet .
3. You can add records for the number of employees. To ensure optimal use, it is recommended to avoid changing employee information unless it was entered incorrectly.
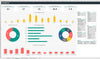
4. The Dashboard tab provides a summary of all the information in the Database. The upper section contains general company information, and the graphs below can be filtered using the Slicers on the left side of the screen.
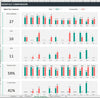
5. The 'Monthly dashboard' tab displays information on Active Employees, Hires, Exits, and Average Tenure for the current year, as well as a comparison against the previous year.
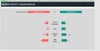
6. The 'Department Comparison' tab allows you to compare two different departments by selecting options from the provided list. Metrics will be displayed for comparison below.
Please note that this is a template worksheet. If it does not meet your needs 100%, and you are unable to customize it yourself, let me know and we will provide a quote to develop the customisations you need to get you exactly what you want in your HR KPI Dashboard Excel Template.
This Best Practice


