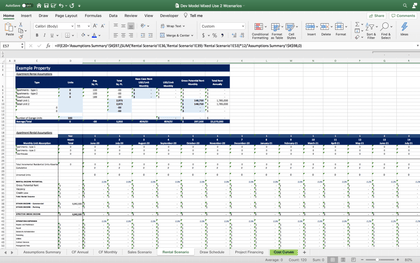
Rental Business: 5-Year Startup Model and DCF Analysis
Latest update: Integrated a three statement model (monthly and annual Income Statement, Balance Sheet, Cash Flow Statement) and cap table.
This is a 5-year startup financial model designed for any that needs to create a forecast in the general rental / equipment rental industry. Configurations are highly dynamic and flexible in order to create estimated revenues and expenses as well as automate depreciation / net income after tax expectations on a monthly and annual basis.
The model was built to handle up to 7 purchase tranches for up to 25 categories of units. For example, category 1 could be dozers and you plan on buying ‘x’ dozers at seven different times over the five year period and so on. For each purchase, the user defines:
Date (month)
Cost per Unit
Total Units Purchased
Based on the defined useful life and date of purchase, depreciation expense is automatically calculated in order to get to a more accurate taxable income.
Video Tutorial:
As units are purchased, this triggers revenue. That revenue is driven off of a few key assumptions that include:
Utilization percentage by year per category
Monthly loss rate per category (to account for things that get damaged/lost over time)
Average rental fees per day per category (if things are rented out for extended periods of time, you can take the total fee divided by number of days to get an accurate input here)
Average working days per month
Operating expenses are defined on a fixed cost schedule that lets the user configure the start month of the cost and the amount per month (defined for each year). There are 66 slots for this area and another 5 slots to define any costs as a direct percentage of revenue.
Startup costs can be defined in their own schedule.
One of the more advanced configurations built for this model was the frequency for which things are rented out for. This lets the user define costs for deliver and return based on the expected frequency something is rented for (once a month, once every 3 months, once every ‘x’ months)
Final output summaries include a monthly and annual pro forma that drives down to EBITDA and further down to Net Income after tax and cash flow. There is also a high level annual summary that just shows key financial line items, a DCF Analysis for the project, owner, and investor if applicable, and lots of visualizations.


