Dashboard for Job Costing / Performance Tracking
Dashboard for Job Costing / Performance Tracking
Available:
In Stock
$40.00
If your organization has multiple teams working on multiple jobs at once, it may be hard to track who did what on what jobs. This simple tracker will structure all the needed inputs so that data can be summarized and aggregated over time and across a single team / all teams and/or a single team member / all team members.
It can be difficult to look back and understand all the hours billed for a given job if there are a bunch of things going on at once. This database structure will make it simple. As long as the data is entered for who did what, the summaries all auto-update. The main display is a 12-month view of hours and value of hours over time.
What defines the hourly value is a mapping that the user will enter i.e. the value of each team members hours. The only thing that has to be entered is: date, team, team member, and hours worked. An algorithm will do a 3-step pass/fail check so that the only data being displayed is based on the 3 filters.
The filters are:
1. Team (1 or all)
2. Team Member (1 or all)
3. JobID (1 or all)
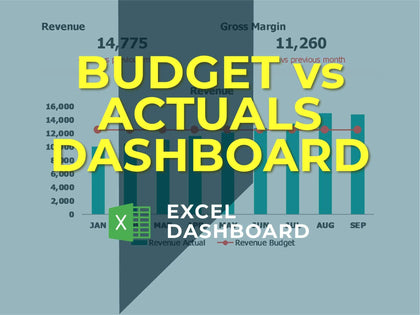
Based on the above, the two visuals will update and as new data is added the visuals update. The purpose of this tracker is to show a summary over a 12-month period. There is also a 52-week view so you can see what has happened on a weekly basis if desired.
Expansion of this tool could include charts that show performance of individual team members against other team members and/or team vs. team. All the data is automatically summarized for that building of such analysis.
The formulas go down 4k rows and can easily be drug down more if needed. If you want to show more than 12-months at a time, you would just drag the monthly formula down as far as needed and re-target the range for the chart and it will pick it up.
I also added a single calculation where you can enter any start date and end date (no constraints) and it will show the total hours / value of hours for that period no matter how far apart the dates are. A complimentary piece to that was a avg. amount per month view that takes the totals for the period defined by the start / end date and divides it by the amount of active months for the period. The user would manually input the active months value.
The user defines the value of each team members hours and that auto-populates the total value of each entry based on the team member selected and the hours entered for the given entry.
This would also work fine if you had just a single crew with multiple members.
Enjoy!


