Set your KPI objectives and your month-to-month financial results and Financial Dashboard Excel Template will take care of creating the beautiful Graphs and Metrics!
The spreadsheet will produce 3 Dashboards that can be seen month by month with growth comparisons and trends.
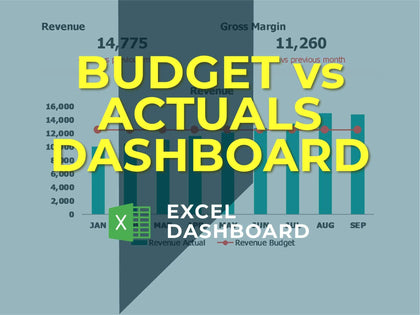
Efficiency Metrics Dashboard - most demanded KPIs to measure the efficiency of your business, like Revenue, Cash Conversion Cycle and Budget versus Actuals analysis of Income Statement
Liquidity Metrics Dashboard - essential KPIs to track liquidity like Accounts Receivable and Accounts Payable Turnover and Current Ratio
Profitability Metrics Dashboard - core indicators to measure are Gross Margin and Net Profit
Financial Dashboard
Key Features
o The smooth dashboard can be effortlessly interpreted for quick decision-making
o Track KPIs (Month to Month and Year to Date)
o See Month to Month information side-by-side to effectively pinpoint vital budget adjustments.
Simple and Professional
o Dynamic charts
o Completely opened template
o No VBA code or Macro
o Ready for print
o Support after your purchase
o Immediate download
o No monthly fees
What is included?
Efficiency:
o DIO - Days of inventory outstanding
o DSO - Days sales outstanding
o DPO - Days payable outstanding
o CCC - Cash conversion
o Revenue YTD - Year to Date, MTD, Growth
o Budget Variance YTD, MTD - Revenue, Expenses, Net Profit
Liquidity:
o Accounts Receivable MTD, Growth
o Accounts Receivable Turnover (days), Growth
o Accounts Payable MTD, Growth
o Accounts Payable Turnover (days), Growth
o Current Ratio
o Working Capital
Profitability:
o Gross Margin MTD, YTD, Growth
o Net Profit MTD, YTD, Growth
Financial Dashboard


