Financial product management is crucial for businesses to ensure profitability and sustainable growth. This spreadsheet offers a comprehensive tool for effectively managing product portfolios with a focus on maximizing margins.
The first tab, titled "Database," serves as the core of the management system. Here, users input data regarding various financial aspects of each product, including Target and Accomplished Expenses, Net Expenses, and Revenue. The flexibility of this tab allows for the inclusion of an unlimited number of products, ensuring comprehensive coverage of the entire portfolio.
Users are encouraged to diligently fill in the necessary information for each product, as this data will drive the subsequent analysis and decision-making processes. By tracking expenses and revenue on a per-product basis, businesses gain valuable insights into the performance of individual offerings.
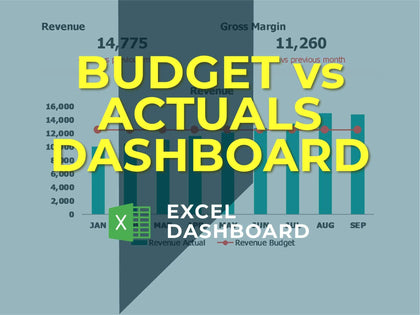
Moving to the second tab, labeled "Dashboard," users are presented with a visually intuitive interface for analyzing key financial indicators. The dashboard provides at-a-glance summaries of crucial metrics, including the percentage of Revenue and Expenses Achievement depicted in donut charts. This visual representation facilitates quick understanding and interpretation of financial performance across the product portfolio.
Additionally, the dashboard features bar charts highlighting the top 10 products based on various parameters such as Expenses, Revenues, Net Margin, Net Expenses, and Gross Margin. This comparative analysis allows users to identify top-performing products as well as areas for improvement or optimization.
Overall, this spreadsheet offers a robust solution for financial product management, empowering businesses to make informed decisions that drive profitability and enhance overall performance. By leveraging the data-driven insights provided by this tool, businesses can optimize their product portfolios and maximize their financial returns.


